The pie charts below compare water usage in San Diego, California and the rest of the world.
该饼图展示美国圣地亚哥县,加利福利亚州和世界其余地方的用水比较。请作答。
雅思图表小作文饼图题型9分范文:
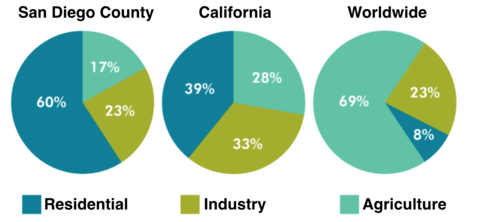
The pie charts give information about the water used for residential, industrial and agricultural purposes in San Diego County, California, and the world as a whole.
It is noticeable that more water is consumed by homes than by industry or agriculture in the two American regions. By contrast, agriculture accounts for the vast majority of water used worldwide.
In San Diego County and California State, residential water consumption accounts for 60% and 39% of total water usage. By contrast, a mere 8% of the water used globally goes to homes. The opposite trend can be seen when we look at water consumption for agriculture. This accounts for a massive 69% of global water use, but only 17% and 28% of water usage in San Diego and California respectively.
Such dramatic differences are not seen when we compare the figures for industrial water use. The same proportion of water (23%) is used by industry in San Diego and worldwide, while the figure for California is 10% higher, at 33%.


